$13 Trillion – The Global Value Of Public Procurement

Ian Makgill, Alex Yeung, Lindsey Marchessault
We often hear about the scale of public procurement. With vast sums of money at stake, it is important that the public procurement market is fair, efficient, and effective.
However, it has been many years since anyone has actually quantified its annual global value. Thus far, there has been no attempt to calculate the value of awarded public contracts published as open data.
Therefore, the Open Contracting Partnership partnered with Spend Network to dig into the data and produce an updated estimated estimate of global public procurement value and the value of public contacts published openly.
In total, we estimate public procurement to be valued at 13 trillion USD per year. Our research found that over $10 trillion or 77% of the total is spent by 17 countries. China is by far the largest procurer at $4.2 trillion. The US by contrast spends less than half of this at $1.8 trillion. 14 countries spend between $100bn and $1trn per annum.
These are Japan, Germany, India, France, the United Kingdom, Indonesia, Canada, Italy, South Korea, Australia, Brazil, the Netherlands, Russia, and Spain.
By contrast the rest of the world spends just over $2 trillion per annum.
How the world compares in public procurement spending $USD
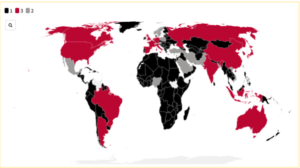
3 (red) = >$100bn
2 (grey) = >=$50bn, <=$100bn
1 (black) = <$50bn
How Much of Public Procurement is ‘Open’?
Once we knew the value of public procurement globally, we set out to understand how much of this value is published as open data. Spend Network collects contract notices from all over the world through http://openopps.com/. By collecting this data, we could work out the value of contracts published as open data.
The amount of value opened up by open data is $362.8bn USD per year. This figure represents 2.81% of the total estimated value of public procurement spend. The amount of value opened up by the Open Contracting Data Standard (OCDS) is $244.4bn USD per annum or 1.88% of the total estimated value of public procurement spend. Of this, the USA publishes the most contract data ($117.8bn or 6.46% of total spend), closely followed by the UK ($101.8bn or 28.36% of total spend).
This figure of $362.8bn represents a baseline. Many more contract notices are published openly around the world but their value is not discernible. In order to calculate annual contract value, each contract notice needs: the value of the contract, the start date and the end date. However, key information is often lacking. For instance, both OCDS publishers (Paraguay and Uruguay), and non-standardized publishers (El Salvador, Argentina, and Norway) often lacked key information around dates.
It is therefore strongly recommended that publishers include end dates as part of their contract data. This would not just allow a valuation of contracts over time but provide data users with a better understanding of when pertinent contracts are due to expire. We also recommend for contract start and end dates to be mandatory on Tenders Electronic Daily. As a key European source of tenders and contracts, this recommendation would allow for a much better, like-for-like understanding of European procurement data. It would also reduce the need for extensive searching and standardisation of national sources such as Doffin and Evergabe.
We also found many examples where data stewardship could be improved. By way of example, on the UK’s Contracts Finder, there are many ‘0’ and blank value contracts being published as well as contracts with end dates that are before start dates. We recommend for all publishers need to maintain and validate their data, even those that publish good data.
The OCDS can be a helpful framework for standardization when combined with tools and processes for ensuring data quality and completeness.
Our Methods
We calculated the global value of public procurement using a combination of research, data linking and refinement, and statistical modelling.
In order to establish what the current state of information is, we gathered existing data from sources such as the World Bank, IMF, OECD and government sources.
We also gathered a number of national metrics tracked and maintained by the World Bank such as GDP, GNI, Military Spend, Tax Revenue, Total Debt Service, Statistical capacity, HCI.
In order to create a model, countries were banded based on GDP. This was done to provide a more refined model of spend that better reflected inter-country difference and capture like for like economies. GDP was chosen because it had the strongest correlation with Procurement Spend. For countries where we did not have data, we applied the regression model. This gave a total public procurement spend of $13trn per annum.
You can read the full report here.
Please get in touch if we can assist you with your government procurement data or research needs.